A theme this week
Most weeks the changes feel like a grab bag of unrelated bits. This week most of them ended up pointing in the same direction: getting more out of shoots you've already done. The ones sat in your history that you maybe glanced at once and forgot about.
There are also some smaller bits, a tuning improvement, and an embarrassing achievement bug to own up to.
Comparing yourself to your previous best
Biggest addition
When you open one of your old shoots, you'll now see a comparison against your previous personal best on that round. Not just "you scored 708 and your PB is 720", but a proper breakdown by distance.
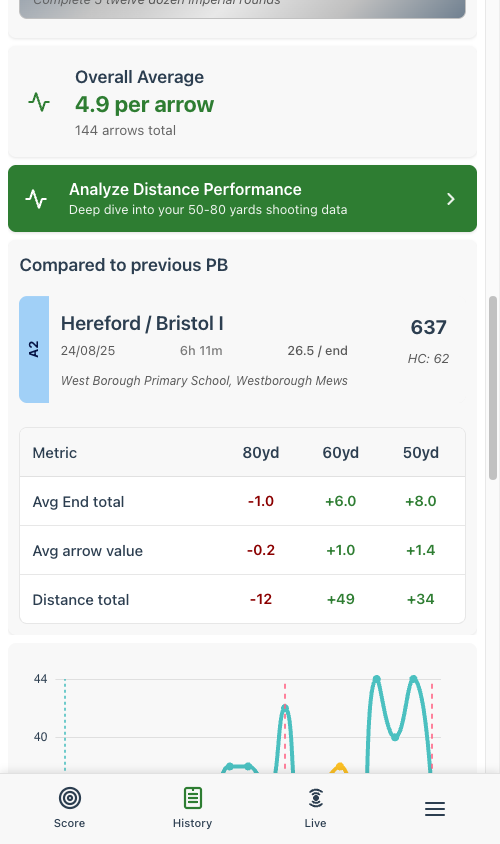
A Hereford / Bristol I compared against my previous PB. The table shows where I gained ground and where I gave it back.
The table tells you, distance by distance, whether you were up or down on your previous best, both in end totals and average arrow value. So when you see that you matched a PB but only because the 50 yard distance saved you, that's something you can act on next time.
If you want a more visual sense of how the two shoots compared, scroll down a little and you'll find the end total chart already overlays your current shoot against your PB, end by end, so you can see where the two tracked each other and where they diverged.
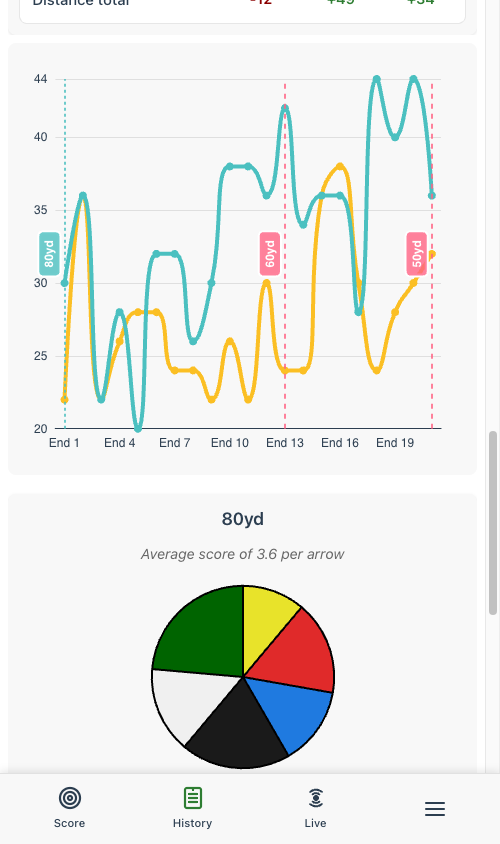
The current shoot in teal, the previous PB in orange. The dashed lines show where the distance changes.
Distance analysis, made obvious
The distance analysis page (which breaks down your scores per distance over time) has been around for a while, but it was tucked away and most people didn't know it existed. It's now a proper green button on the shoot view, sitting where you can't miss it. Tap it and you go straight to a deep dive on the distances you just shot.
If you've ever been told to "work on your 60 yards", this is the page that will tell you whether the work is paying off.
A heatmap on the tuning target
The bare shaft and bracing height tuning tools that landed last week have had their first proper iteration based on feedback. The biggest change is a heatmap layer on the target face that shows where your arrows are clustering across all your experiments.
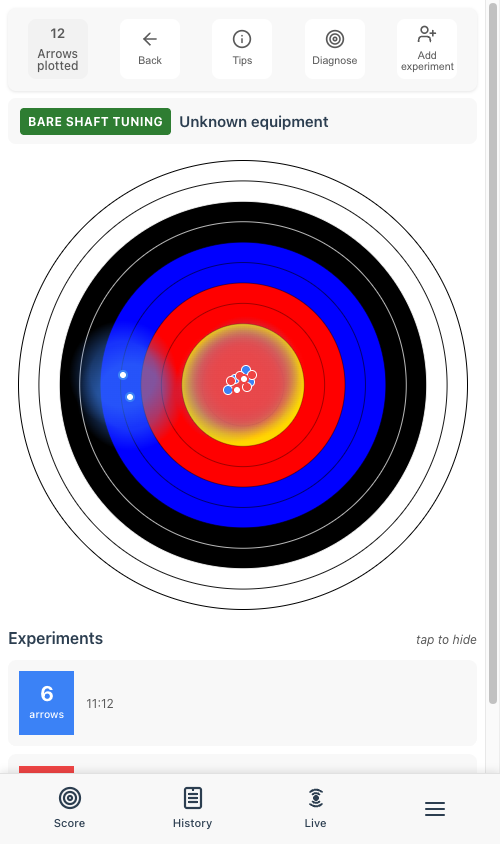
The brighter the patch, the more arrows have landed there. Useful when you're trying to spot whether a group has shifted.
There's also a small but welcome change to the experiment editor. If you've forgotten to record something (like the bracing height), the save button used to grey out and silently refuse you. Now it tells you what's missing, which is a lot less confusing if you're new to it.
Arrows over time, properly
The "arrows shot over time" graph in the history page used to plot every single day, which works fine for a few months of data and becomes an unreadable forest of bars once you've been recording for a year or more.
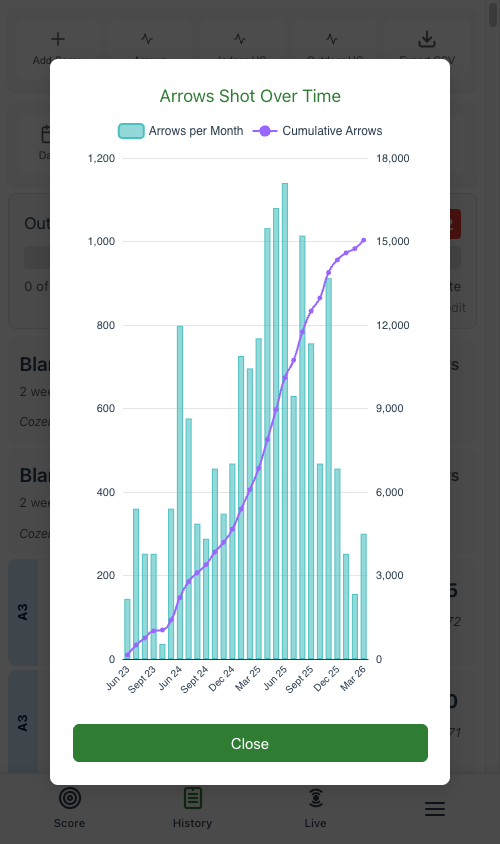
Once you've got over a year of data, the graph automatically switches to a monthly view so you can actually read it.
Now, once you've been recording for over a year, the graph quietly aggregates by month instead. You can see how your shooting volume rises and falls across the seasons, which is the thing this graph was supposed to show all along.
The smaller things that add up
- The app is faster to start. A few bits of behind-the-scenes plumbing have been swapped out for lighter alternatives, so the first load shaves off a noticeable chunk of time, especially on phones with patchy signal.
- The "Back to scoring" button on the error screen now actually takes you back to scoring instead of leaving you stuck on the same error.
- Equipment expanded by default on the shoot view, so you don't have to hunt for what bow you were shooting.
Bug fixes
- The delete button on the shoot view had quietly stopped working entirely. Somewhere along the way it broke, and tapping it would just crash the app. It's now fixed, and I've added tests around it that should all but guarantee this particular embarrassment doesn't happen again.
- Cumulative achievements (the ones you build up arrow by arrow) were labelled "Best" when they should have said "Progress". A small thing that confused me every time I looked at it.
- Colour achievements were wired up wrong. The check for "land an arrow in the blue ring" was running the code for "land one in the red ring", and so on across the colours. So if your colour achievements have suddenly become more or less generous than you remember, that's why. Apologies. The underlying setup that made this possible has also been reworked so it can't quietly happen again.
What's next
I'd like to keep going on the "look back at your shoots" theme. There's plenty more that could be surfaced from the data you've already entered, and the PB comparison feels like the start of something useful rather than the end of it.
As ever, if something doesn't work the way you'd expect, or you spot something I've missed, let me know on Facebook. Thanks to everyone testing.